Pinpoint Monitor displays, plots and logs data all in real time.
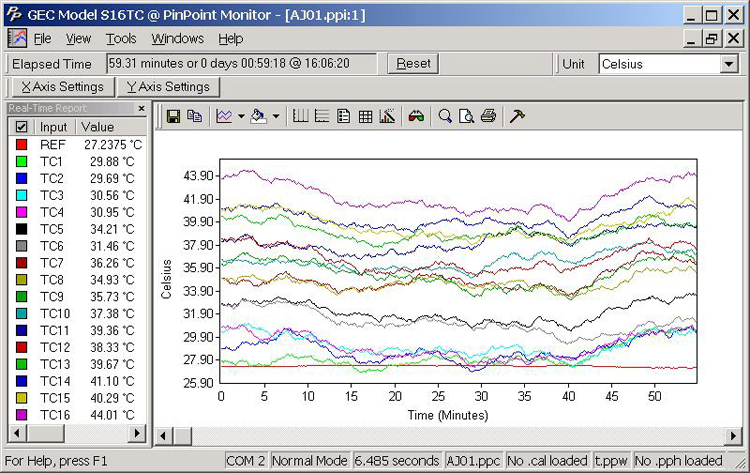
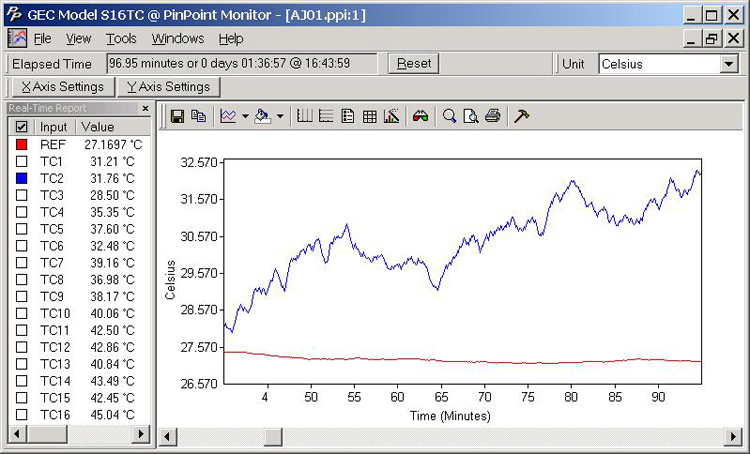
Select channels of interest and the chart will automatically zoom to show only the information you wish.
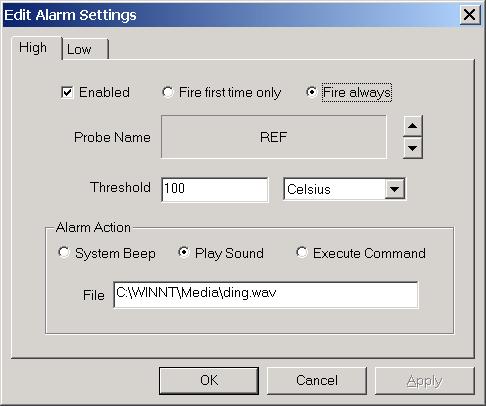
Set alarms to play sounds or execute arbitrary system commands when temperature thresholds are exceeded.
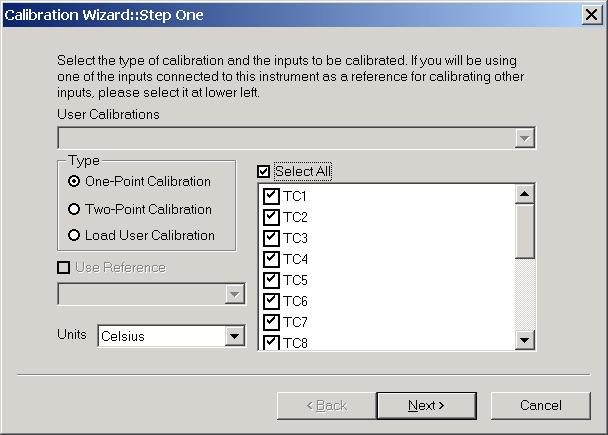
You may perform custom calibrations on any or all thermocouples.
Manage your logs all in one place; activate each with a click, or schedule them to start and stop automatically.

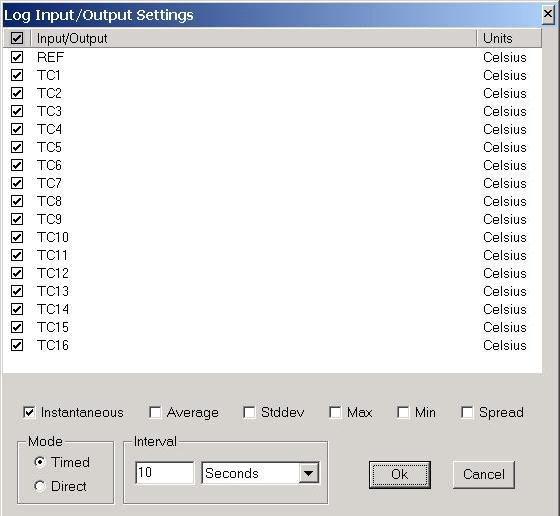
Store permanent records of your data in a database. Logs may be configured to operate at different scan rates including arbitrary channels and common statistics of interest.
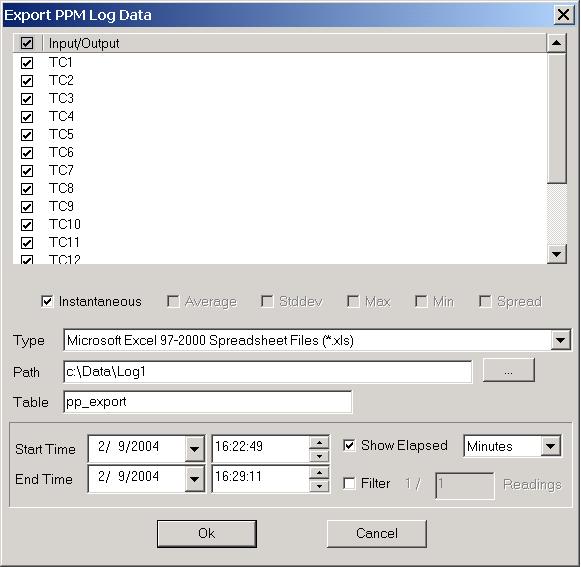
Export log data to a variety of output formats, including Microsoft Excel for further analysis
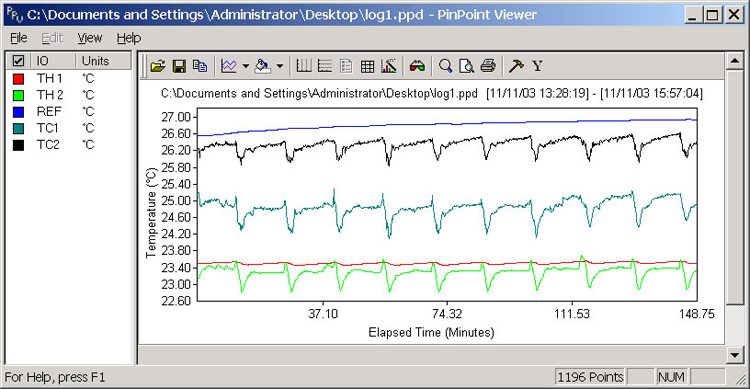
Or view logs graphically at any time with the included Pinpoint Viewer.
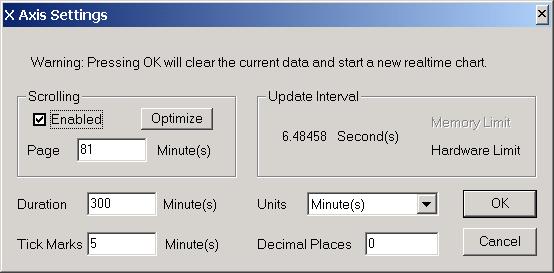
Optimize chart settings to fit the most data possible on your screen, or set a more leisurely pace for long term viewing.
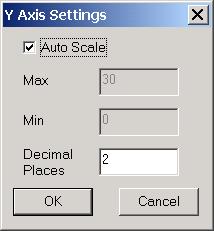
Control autoscale behavior, or fix limits as you wish.
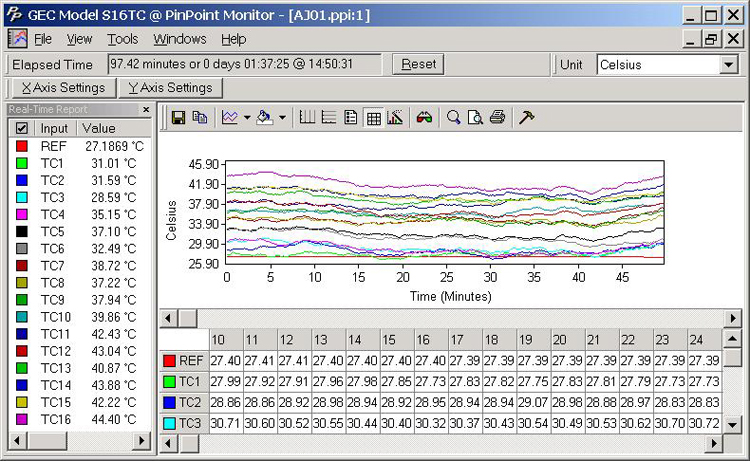
See a detailed report of the data in the real time plot with the included viewer.
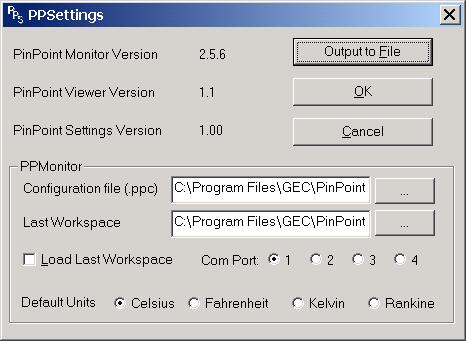
Maintain application wide settings such as COM port and default temperature units with PPSettings.
If you are interested in more details of the software, download and install
our software demo program and launch it, then click on Help >> PPM Help.

